How Does Simple Linear Regression Work In Machine Learning?
When you think about simple linear regression, think about predictions. The main goal of this machine learning algorithm is to use the historical relationships between an independent and a dependent variable to predict the future values of the dependent variable. It is called simple linear regression when in making the prediction model it is used only one independent variable. When there are used more independent variables it is called multiple regression, but we will talk more about it in another article.
Also, regression models can be either linear or nonlinear. A linear model takes place when the relationships between variables are straight-line relationships, while a nonlinear model means that the relationships between variables are represented by curved lines.
Businesses use regression to predict things such as:
Dependent variable is a characteristic whose value depends on the values of independent variables. The dependent variable is also referred to as the outcome, target or criterion variable
Example of dependent and independent variables in linear regression:
Selling price = 40.000 + 100 (Sq.ft.) + 20.000 (#Baths)
In the above example, the selling price is the dependent variable because its outcome is based on regressor variables, such as:
Also, regression models can be either linear or nonlinear. A linear model takes place when the relationships between variables are straight-line relationships, while a nonlinear model means that the relationships between variables are represented by curved lines.
 |
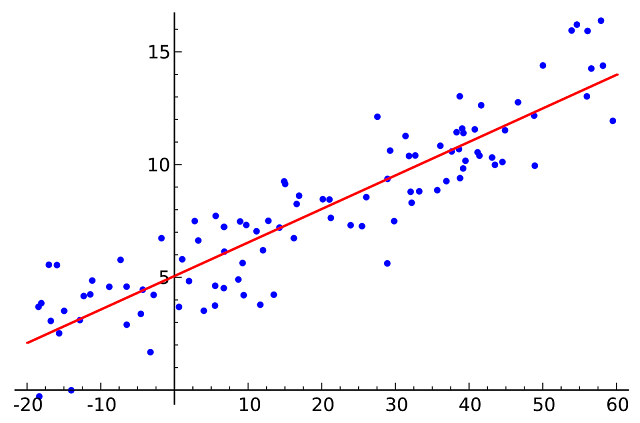
| Linear Regression. Photo source: en.wikipedia.org |
Businesses use regression to predict things such as:
- future sales
- stock prices
- currency exchange rates
- productivity gains resulting from a training program.
What is the difference between dependent and independent variables in regression analysis?
Independent variables are characteristics that can be measured directly (for example, the area of a house. These are also referred to as the predictor, explanatory or regressor variable.Dependent variable is a characteristic whose value depends on the values of independent variables. The dependent variable is also referred to as the outcome, target or criterion variable
Example of dependent and independent variables in linear regression:
Selling price = 40.000 + 100 (Sq.ft.) + 20.000 (#Baths)
In the above example, the selling price is the dependent variable because its outcome is based on regressor variables, such as:
- the constant term or the fixed price of the house (40.000)
- the coefficient of Sq.Ft. (100) which is the change in selling price for an additional Square Foot;
- the number of baths (#Baths)
Selecting independent variables: Scatter Plots
Scatter Plots are used to visualize the relationship between any two variables. This relationship can be expressed mathematically in terms of a correlation coefficient, which is commonly referred to as a correlation. Correlations are indices of the strength of the relationship between two variables and they can be any value from –1 to +1.
The regression line is the line with the smallest possible set of distances between itself and each data point.
 |
| Regression line. Photo source: ci.columbia.edu |
The untouched data points from the regression line are called error terms.
 |
| Error terms. Photo source: ci.columbia.edu |
Resources:
- Statistical Sampling and Regression: Simple Linear Regression
- [PPT] Regression Analysis: Estimating Relationships
- Linear regression analysis using Stata


Would you be interested in trading links or maybe guest writing a blog post or vice-versa?
ReplyDeletebest machine learning course in india
best machine learning course online